
Enhancing Betting Strategies with Horse Race Analysis
I’ve always been a pen and paper kind of handicapper, and that’s the foundation of this site. Think of it as a tool designed to help you build smarter betting strategies for any race you want to examine.
Here’s how it works: I start by reviewing the past performances and then drop that information into the custom code I’ve built. The system processes a wide range of key factors track bias, jockey/trainer win percentages, workout patterns, pedigree, form cycles, and in return, my system will highlight the most probable winners.
The analysis isn’t just about pointing to horses; it’s about providing context to a handicapper. Pay close attention to the verbiage in the analysis my system generates, because it often reveals where overlays and underlays may exist. Spotting those value opportunities is what ultimately impacts your return on your betting strategy.
This project is fueled by my love for horse racing and the tight-knit community of handicappers who share that same passion. My competitive nature and drive to solve challenges inspired me to build this site, and I’m committed to constantly improving it. See below Step by Step instructions on how use the handicapping tool.
Your feedback matters. Whether it’s thoughts, insights, or critiques, I welcome it all, because continuous improvement applies not just to handicapping, but to everyday life.
HOW TO USE HANDICAPPING PICKS TOOL:
STEP 1:
STEP 2:
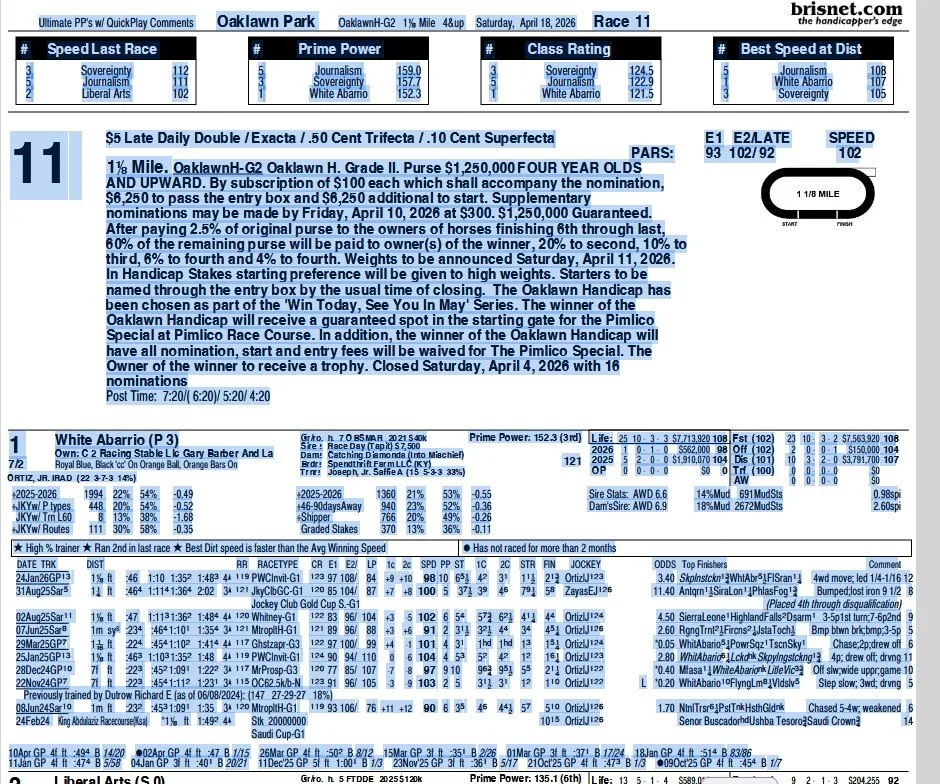
Once you download the Ultimate PP from BRISNET. Copy the entire SINGLE race you want to handicap. You have 2 options with extracting the PP on my website. Copy And Paste (preferred method) or extract the PDF file. As of now, copy and paste method is more accurate at extracting every statistic and angle from PP. I use PDF more for quick Pick 3, Pick 4, Pick 5 analysis.
STEP 3:
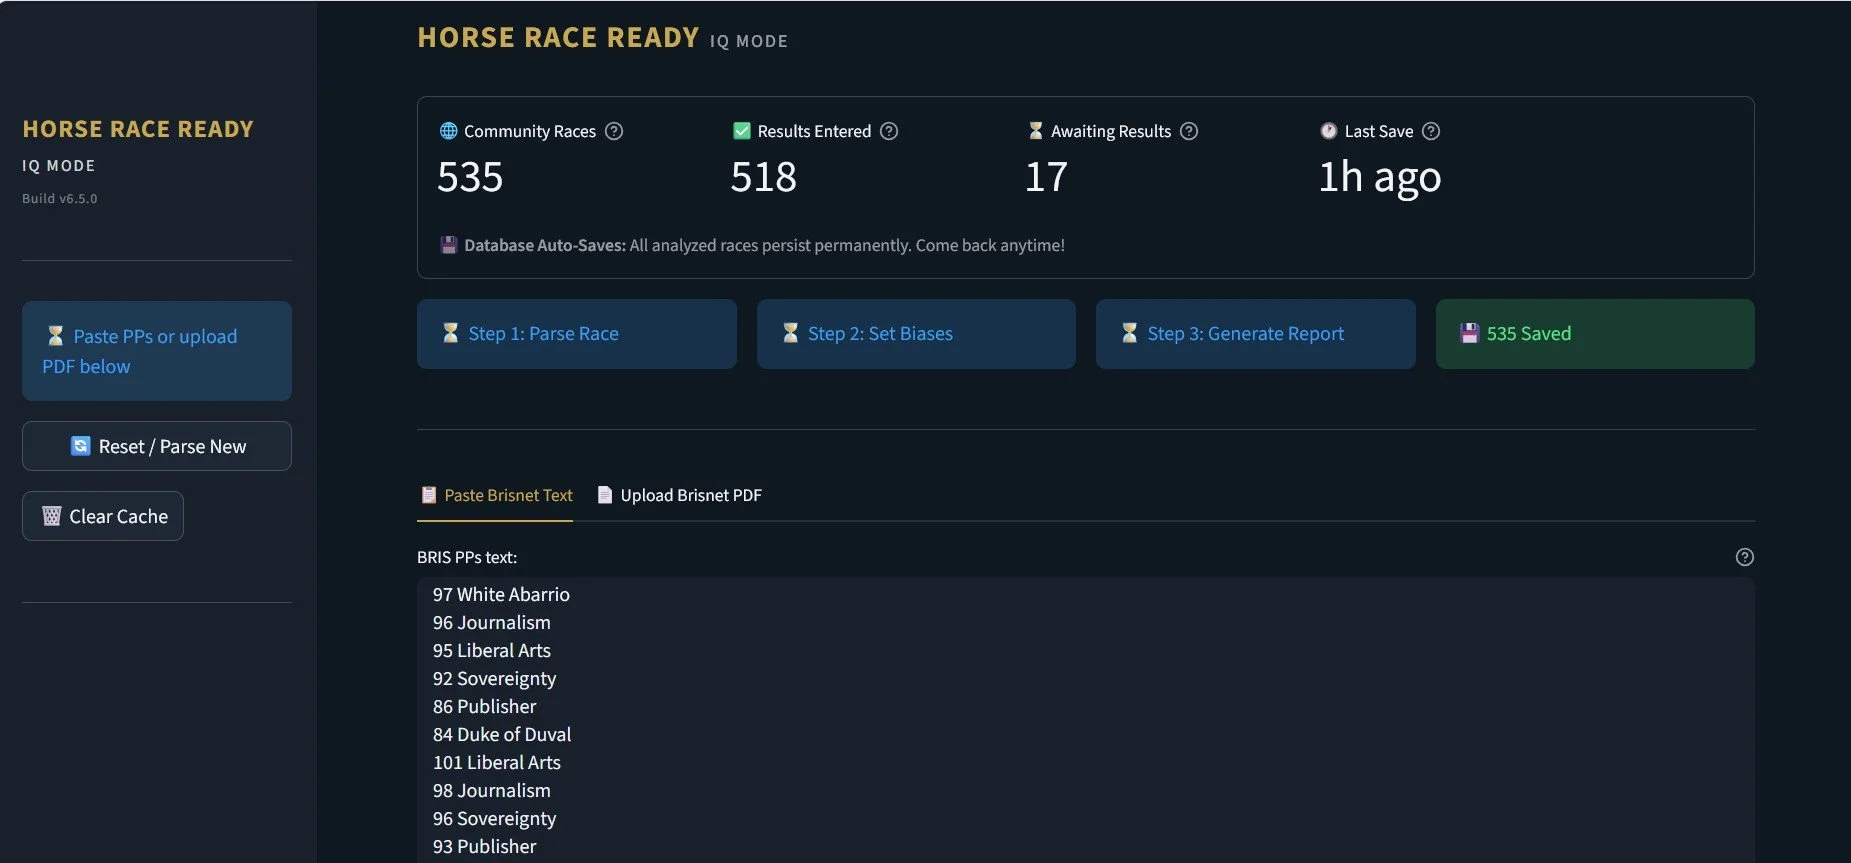
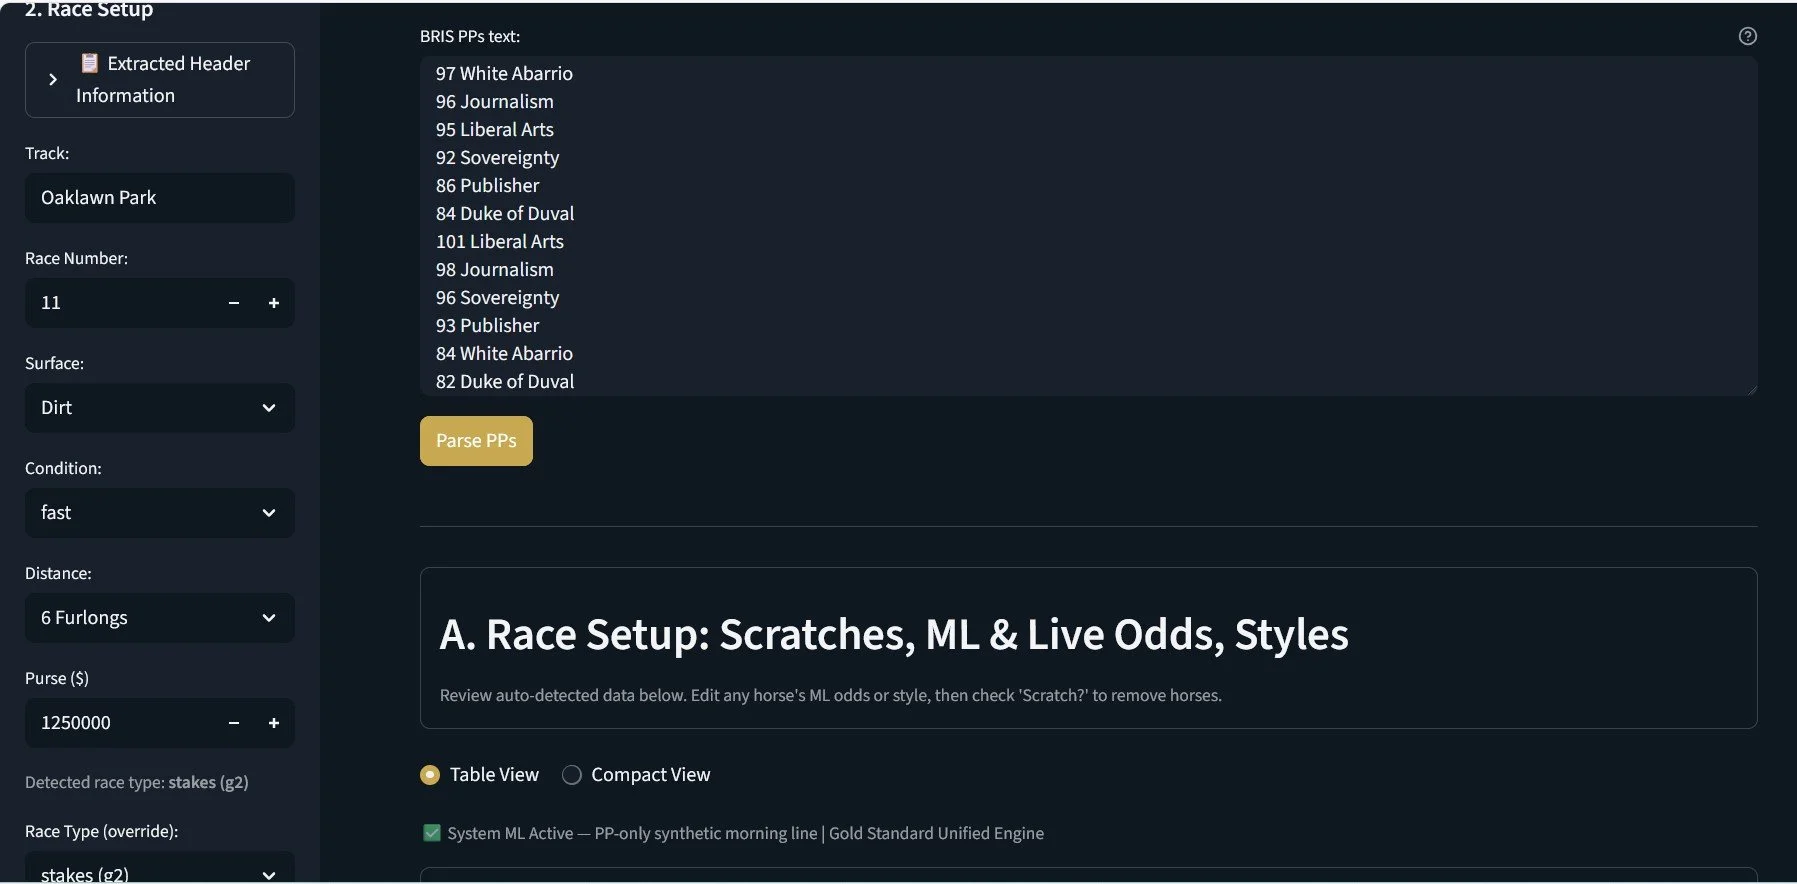
You will see a text box as seen in picture. This is an easier process then it looks. 1) Paste your race into the text box. 2) Scroll down till you see the button PARSE PP and Click button. 3) After you parse the race, use the left Scroll bar and make sure everything populated in “Race Setup” is correct. You will see surface type, track condition, track distance, purse amount, and type of race. My system is designed to over ride with manual input in case distance and type of race was parsed incorrectly.
STEP 4:
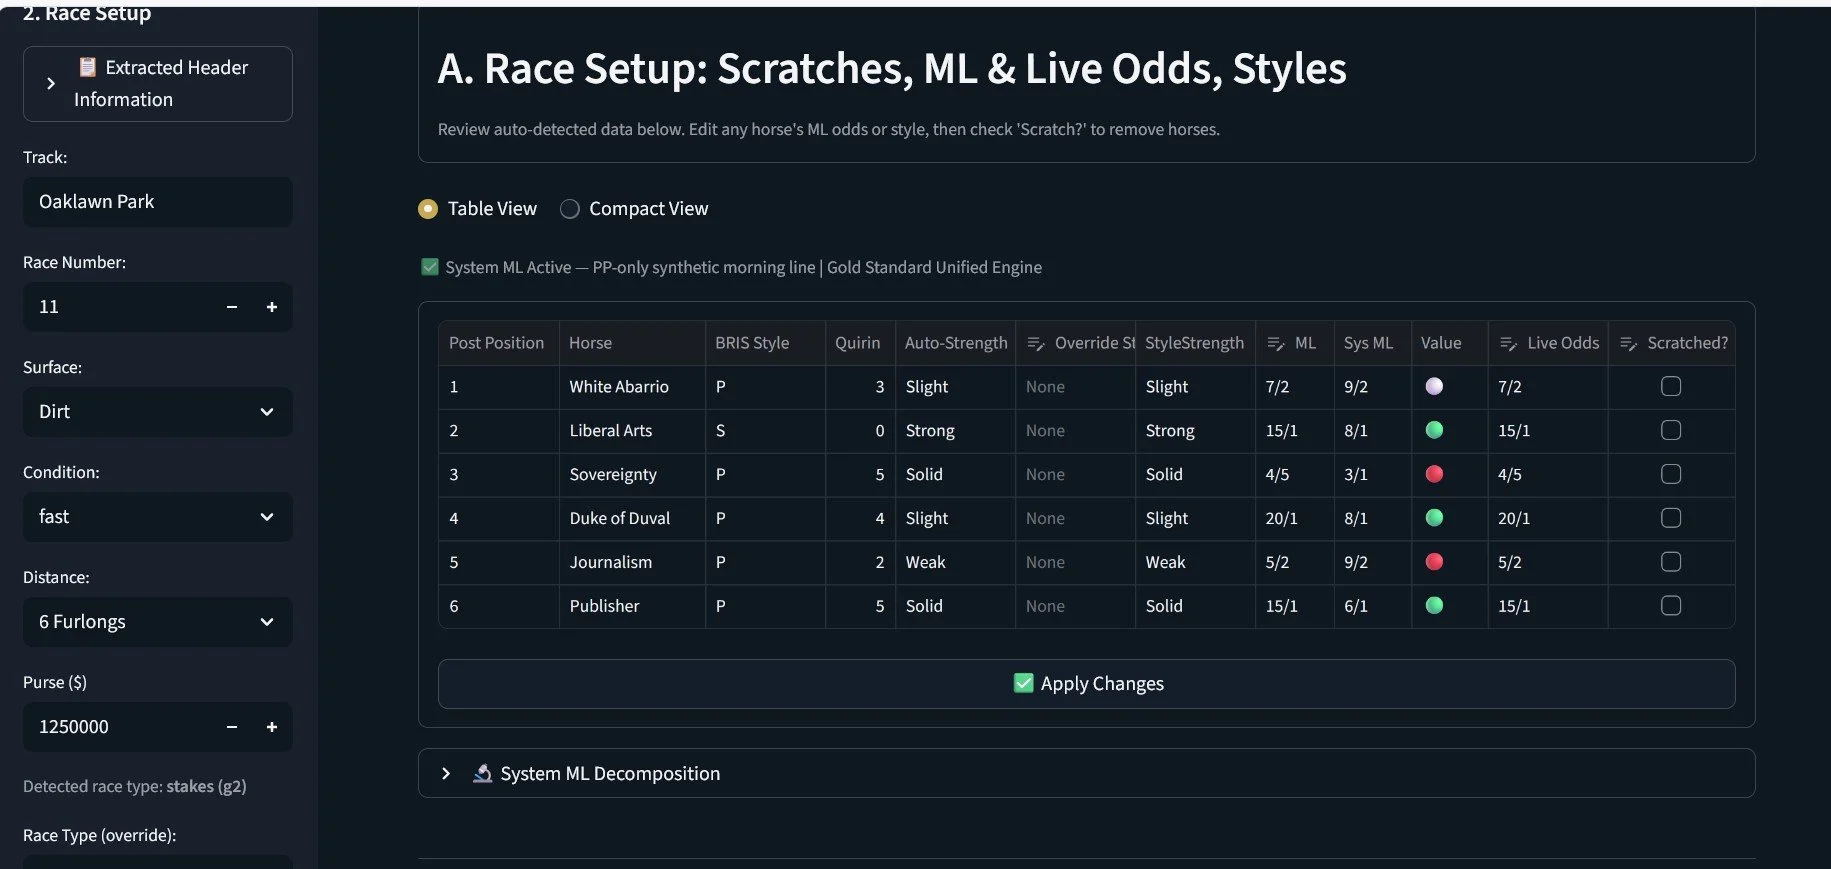
Go to Section A table and enter in the Live Odds and Scratches for the race and then click “Apply Changes” button. You will see 3 different categories for Morning Line Odds. You have BRIS ML odds, System ML odds, and Live Odds by design. If you want complete accuracy for a single race handicap, I recommend inputting Live Odds for each horse. The idea behind “System ML” odds is to get more accuracy when putting together a Pick 3, Pick 4, Pick 5 exotic ticket structures.
STEP 5:
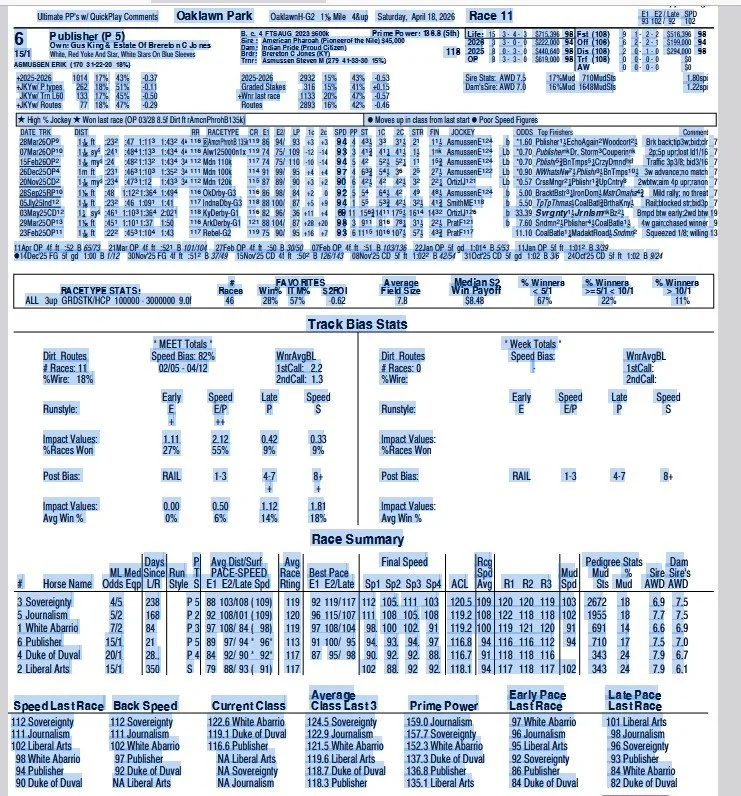
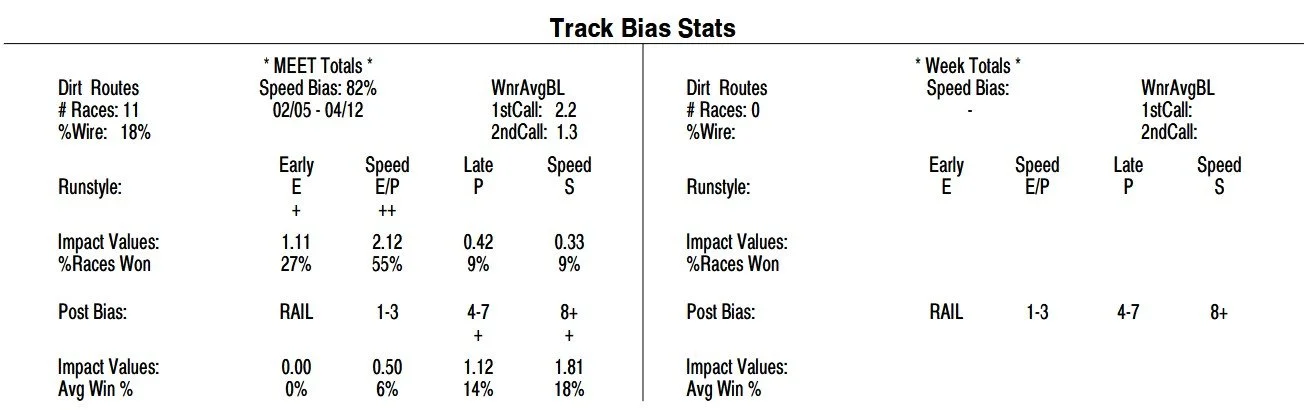
Enter in the race Running Style and Post Position Bias. The BIAS is found at the bottom of each race’s PP as seen in the example below. I typically take highest winning averages from both meets and combine.
![Screenshot of a bias-adjusted ratings dashboard showing a green indicator labeled [OFFICIAL], with sections for strategy profile, running style biases, and post position biases.](https://images.squarespace-cdn.com/content/v1/68ba2944bfa4362ccf1369f4/32847312-1c50-4b33-bcbd-0ad806c5e882/Step+5.jpg)
STEP 6:
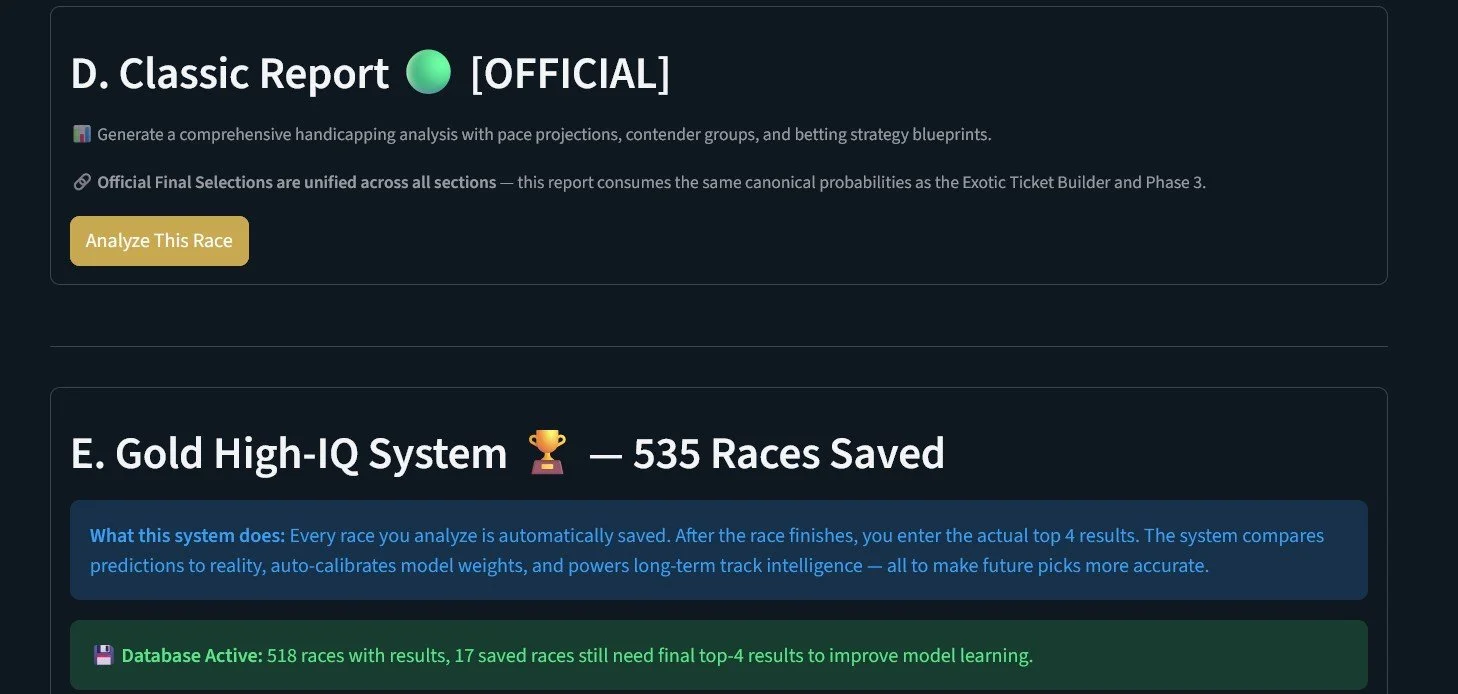
You can now click “Analyze This Race” to get the ticket strategies. The system is very detailed with many different betting strategies at your disposal. My system is designed to give you the Top 5 Contenders. I recommend looking at the Elite Impact Analysis and Per Horse Impact Details in Section C along with the Overall Race Analysis for putting together your ticket strategies. Please also check out Section E and check out the “Track Intelligence” tab as this is the backbone of my system. This is a database that collects multiple data points. It is designed to auto calibrate weighted values after each race using the premise of taking the systems predicted vs actual results of the Top 4 running order of each horse race that is handicapped. My thought process for the database is to have adaptive intelligence and grow smarter over time with the data it collects.
Why This Approach Works
Removes emotional bias
Processes more data than manual handicapping
Identifies overlooked contenders